Simplifying Data Management in Businesses
Data literacy as a milestone for successful data management
With just a few clicks, every employee can gain deep insight into company data - without the challenges of complex business intelligence tools. The promise: simplified data management for analysing and processing sales figures, customer data or financial metrics. AnalyticsGate is a purpose-built tool that exports data from Qlik Sense to Excel at the touch of a button. It reduces the complexity of Qlik Sense by seamlessly transferring data from the BI tool to the familiar Excel format. This simplification makes data processing accessible to employees at all levels.
In this article, you will learn:
- How AnalyticsGate enables the transfer and use of Qlik Sense data in Excel.
- The specific benefits of AnalyticsGate for employees without in-depth BI knowledge.
- Practical examples of AnalyticsGate applications in real business scenarios.
AnalyticsGate offers a user-friendly solution to simplify the handling of business metrics and KPIs, bridging the gap between sophisticated data analysis and everyday work efficiency.
Thomas Hänig,
data analyst and AnalyticsGate developer
AnalyticsGate's role in data analysis
By integrating Qlik Sense into Excel, AnalyticsGate overcomes the challenge of complexity for standard users. This Excel add-in is specifically designed to make working with complex data easier for employees without specialised BI knowledge. It provides seamless and familiar access to business intelligence data, ideal for those who rely on Excel in their daily work. Productivity gains through automation, data availability and timeliness can be realised in the long term.
By using AnalyticsGate, employees without in-depth BI knowledge can:
- Easily access Qlik Sense data in Excel
- Create data analyses and reports that would otherwise require complex BI operations
- Make decisions based on accurate, timely data without getting lost in technical details
Benefits and applications of AnalyticsGate in practice
AnalyticsGate is changing the way people in organisations work with important data such as financial data, profit and loss statements, sales figures, customer data and cash flow.
Want to know how to get started? Our Business Intelligence Guide for organizations shows you how to implement successful BI reporting in your company. This will increase your productivity in dealing with corporate data and thus increase your turnover.
Back to the topic. We recently had the opportunity to get feedback from two AnalyticsGate customers who have successfully integrated the Excel add-in into their daily work.
P&L case study
In the first case study, the introduction of AnalyticsGate led to a significant simplification in the preparation of the legally required annual profit and loss statement (P&L). Thanks to the availability and structuring of up-to-date data, which can be retrieved by the controlling department on demand, the P&L process can now be carried out faster and more easily.
The implementation of AnalyticsGate and the associated automation allows the company to produce its profit and loss statement at any time, not just once a year. This increased frequency provides a deeper insight into the company's financial situation and enables better allocation of financial resources. With a more regular P&L, the company is now able to make its financial strategy more effective and thus optimise its financial planning.
Targeted marketing case study
In another case study of an e-commerce company, AnalyticsGate played a key role in transforming marketing strategies. Prior to implementing AnalyticsGate, the company relied heavily on manual segmentation of customer data. With the introduction of AnalyticsGate, the company can now perform this process faster and easier by directly analysing real-time data from Qlik Sense.
The add-in is also being used to analyse purchase history and assess the Customer Lifetime Value (CLV) of its customers. With this detailed insight, the company can more accurately target its email marketing campaigns to customer segments with the highest revenue potential.
The company also actively uses AnalyticsGate to analyse demographic data to develop personalised marketing strategies for different customer groups. By combining these in-depth analyses - purchase history, CLV and demographic data - the e-commerce company is currently creating campaigns that are more relevant and effective.
Specific applications and benefits of AnalyticsGate:
- Financial data at your fingertips: Employees can access and analyse current financial data directly in Excel, simplifying the creation of financial reports and budget plans.
- Detailed sales analysis: Sales teams benefit from the ability to monitor and analyse sales figures and stock levels directly in Excel, helping them to stay on top of things.
- Optimise cash flow: With up-to-date cash flow data, managers can plan liquidity more efficiently and better assess risks.
- Customer data analysis: Marketing and customer service teams can more easily segment and analyse customer data to create tailored marketing campaigns and provide better customer service.
Examples of AnalyticsGate applications in a business context
The following examples illustrate how AnalyticsGate can be specifically used in various departments of a company.
- Finance department - budget monitoring and planning: Finance staff use AnalyticsGate to import 2022 assets and liabilities from the Qlik Sense Cloud into Excel and instantly compare them to the 2023 budget. This allows them to quickly adjust spending plans based on actual figures.
- Sales management - analysis of sales trends: A sales manager uses AnalyticsGate to analyse monthly sales figures for different product categories in Excel to determine their market share. They can immediately identify trends and adjust sales strategies accordingly to increase market share.
- Marketing - customer segmentation and campaign analysis: Marketing uses AnalyticsGate to transfer customer data, such as purchase history and demographics, from Qlik Sense to Excel. There, the data is segmented to develop targeted email marketing campaigns for individual customer segments.
- Management - decision-making based on current business metrics: A CEO uses AnalyticsGate to enable his staff to generate reports on business metrics such as cash flow, profit and loss statements and customer growth data. This information enables them to make informed strategic decisions.
Check out our Business Intelligence for organizations guide for all the basics.
How data analysis and reporting in AnalyticsGate can look like in practice is shown in the following step-by-step overview. You can download AnalyticsGate for free and work with our demo templates to see if and for which tasks our add-in is suitable for you.
Opening the AnalyticsGate dashboard in Excel
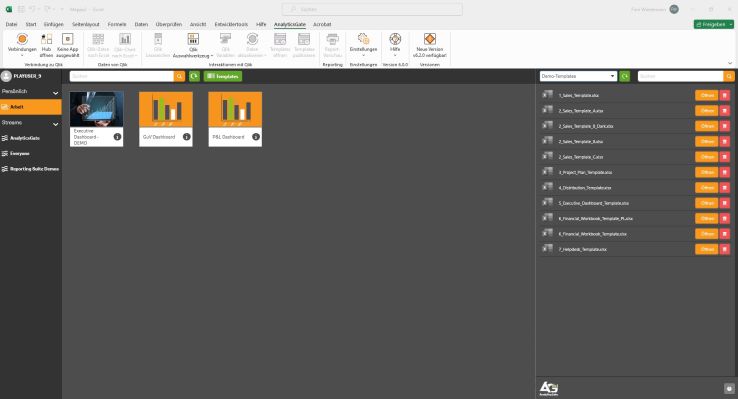
Download and installation: Download AnalyticsGate and follow the installation instructions. Once the add-in is installed, you can see its functions under the "AnalyticsGate" tab. Connect to our demo server using the "Connections" function and then "AnalyticsGate – Demoserver."
Here you will see an overview and the available demo applications.
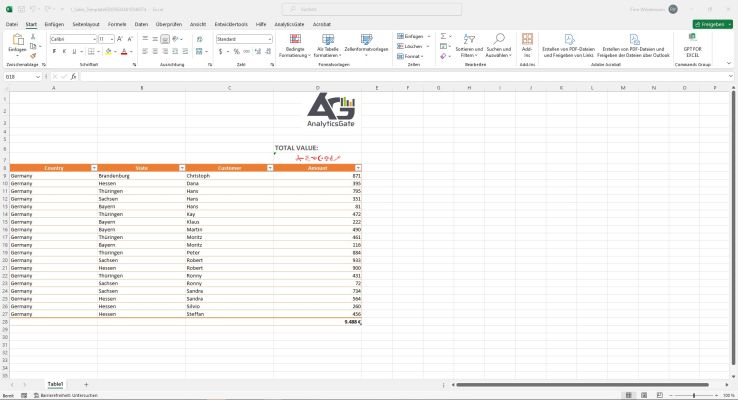
Usage: Select the desired application and load any table into your Excel workbook using the "Qlik Data to Excel" function. You can now work with the demo data in Excel as you wish.
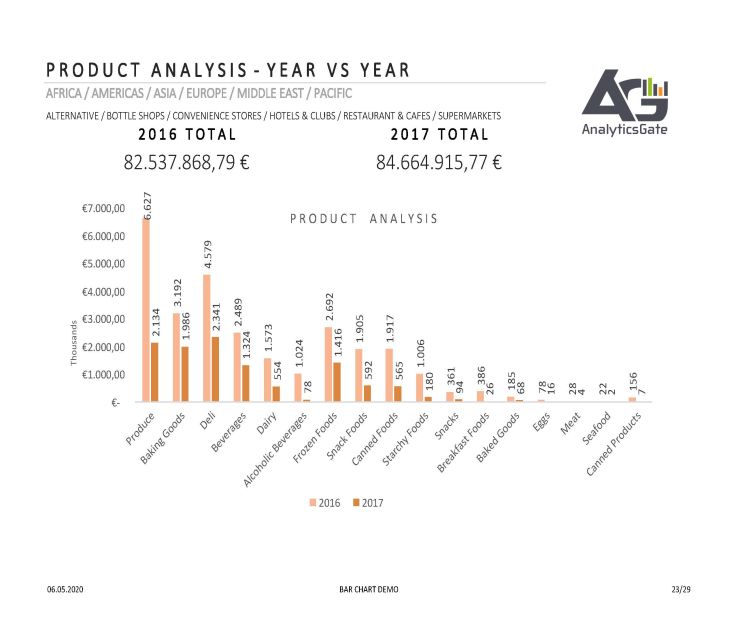
Here we have chosen the example of a simple sales statistic. Depending on your requirements and based on the available data, you can specifically add or remove KPIs such as Customer Lifetime Value, demographic data, etc.
Usage: This example template allows for detailed analysis of sales figures for customers to optimize sales strategies and customer relationships.
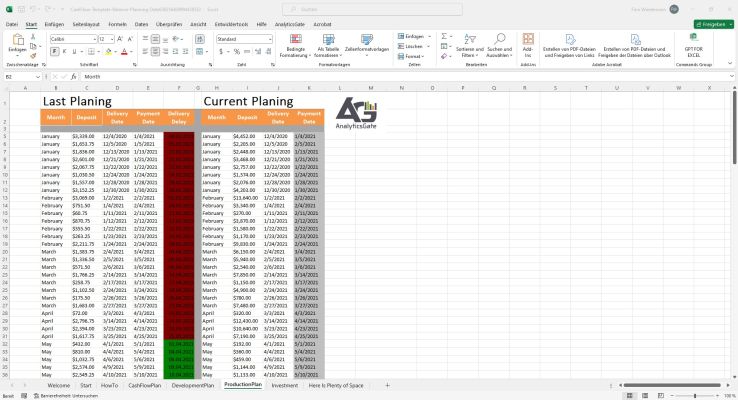
Cash flow analysis
Transfer your data easily from Qlik Sense to Excel to view the current cash flow in the company at any time. Since the data in the Qlik Sense database is always up to date, users no longer need to worry about the currency and accuracy of the data, allowing them to work more productively and quickly.
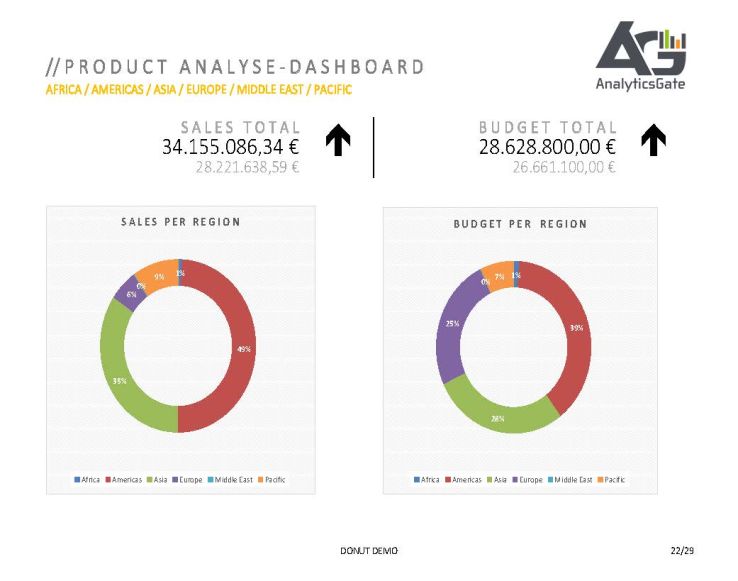
Usage: With this example, you can analyze the distribution of products or services across different channels or regions and make strategic sales decisions.
Financial reporting made easy
Transfer your data easily from Qlik Sense to Excel to view the current cash flow in the company at any time. Since the data in the Qlik Sense database is always up to date, users no longer need to worry about the currency and accuracy of the data, allowing them to work more productively and quickly.
Usage: This example shows what a comprehensive financial or key figures report might look like.
AnalyticsGate - Making data work for your business
We have given you a clear insight into how AnalyticsGate can become a functional tool for efficient and effective data work in companies. Our tool enables employees from different departments to seamlessly transfer and integrate complex data from Qlik Sense into the familiar Excel environment. This makes data analysis not only more accessible, but also much more practical in day-to-day work, even without technical expertise.
Main benefits of AnalyticsGate:
- Enables direct access to current and relevant company data in Qlik Sense via Excel.
- Simplifies complex data analyses and makes important datasets accessible to all employees.
- Supports precise and informed decisions through up-to-date and accurate data.
AnalyticsGate is therefore not only a relief for employees who work with data on a daily basis, but also a strategic advantage for the entire company. By improving data accessibility and processing, it contributes to increased efficiency and better decision making.
You can find out more about how your company can benefit from our Qlik Sense extension here.


