Qlik.SenseEV
von Jan-Philipp Kalus (Netzhirsch)
Get your KPI values from the Qlik Sense data model very easily.
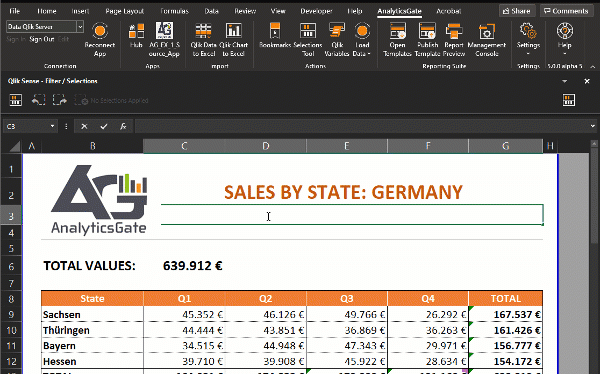
The KPI visualization can show one or two measure values, and is used to track performance. Use KPIs to get an overview of performance values that are crucial to an organization. Uses color coding and symbols to indicate how the figures relate to the expected results.
Creating a KPI with the “SenseEV or Qlik.SenseEV” Excel Functions.
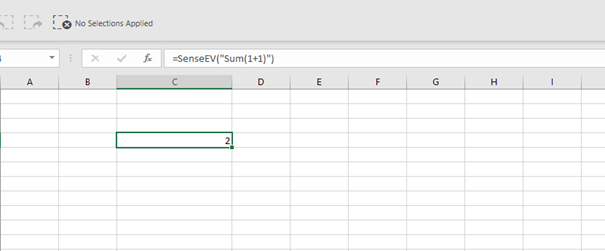
SenseEV stands for Sense Evaluate and enables Excel to call any Qlik Sense function including set analysis within an Excel formula in a discreet cell.
Qlik.SenseEV Examples
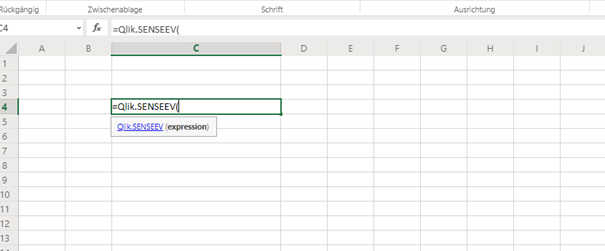
Use AnalyticsGate “Qlik.SenseEV”

The APPID and SERVER parameters are optional settings.
- =Qlik.SenseEV("Function("Expression","APPID","SERVER")")
Simple sum with one measure.
- =Qlik.SenseEV("Sum([Amount])")

Sum with single set analysis parameter. Excel formula set to allow filling down.
- =Qlik.SenseEV("Sum({<[Quarter]={'"&$B4&"'}>} [Amount])")
Sum with single set analysis parameter. Excel formula set to allow filling down. 2nd parameter, GUID to pull from different app.
- =Qlik.SenseEV("Sum({<[Quarter]={'"&$B4&"'}>} [Amount])","eba546df-658a-4b6d-bee5-42d3f9fa55e2")
Sum of revenue measure created from 2 fields. 2 set analysis parameters. First parameter set to populate from Excel cell values and fill down. Second paramter uses Excel “Substitute” formula to extract value from header cell, C5, and able to fill across.
- =Qlik.SenseEV("Sum({<[Product Group Desc]={'"&$B7&"'}, [Fiscal Quarter] = {'"&SUBSTITUTE(C$5,"Q","")&"'}>} [Sales Quantity]*[Sales Price])")
Sum of revenue measure calulated on the fly from 2 fields. First parameter set to populate from Excel cell values and fill down. Second set parameter set to only calculate revenue for the most recent year in the data.
- =Qlik.SenseEV("Sum({<[Product Group Desc]={'"&$B7&"'}, [Fiscal Year] = {'<$(=max([Fiscal Year]))'}>} [Sales Quantity]*[Sales Price])")
Adds a function to triple the value of the entire calculation.
- =Qlik.SenseEV("Sum({<[Fiscal Year] = {$(=max([Fiscal Year]))}>} [Sales Quantity]*[Sales Price])")*3
Only calculates for “Last Year”.
- =Qlik.SenseEV("Sum({<[Fiscal Year] = {$(=max([Fiscal Year])-1)}>} [Sales Quantity]*[Sales Price])")
Dynamic title to show the text “PRODUCT SALES VOLUME” along with each selected value of region delimited by a “/” for the most recent year.
- =Qlik.SenseEV("'PRODUCT SALES VOLUME '&Upper(Concat(distinct [Region],' / ')) &' '& max([Fiscal Year])")
Dynamic title to show each selected value of region delimited by a “/”.
- =Qlik.SenseEV("Upper(Concat(distinct [Region],' / '))")
Formula to quickly populate an array. Measure created on the fly with two set parameters both referencing Excel cell values. First set value allows filling down, second set value allows for filling across.
- =Qlik.SenseEV("Count({<[Case Owner Group]={'"&$A4&"'}, [Priority] = {'"&B$3&"'}>} [%CaseId])")
3 set values set to dynamically filter data based on column header values from Excel cells. 1st and 2nd levels are fixed. 3rd level allows filling down. 4th and 5th levels filter for only income statement and actual values.
- =Qlik.SenseEV("Sum({<[1st Level]={'"&$B$12&"'},[2nd Level]={'"&$B$14&"'},[3rd Level]={'"&$C15&"'},Statement={'Income Statement'},DataCategory={'Actual'}>} [Amount])")
Same as above additionally filtered for only most recent year’s data.
- =Qlik.SenseEV("Sum({<[1st Level]={'"&$B$12&"'},[2nd Level]={'"&$C13&"'},[Year] = {$(=Max([Year])-1)},Statement={'Income Statement'},DataCategory={'Actual'}>} [Amount])")
Filters for only the data from 1 year prior to the most recent values of date in the data.
- =Qlik.SenseEV("Sum({<[1st Level]={'"&$B$12&"'},[2nd Level]={'"&$C13&"'},[AsOfMonth]=,[DateCounter] = {$(=Max([DateCounter])-12)},Statement={'Balance Sheet'},DataCategory={'Actual'}>} [Amount])")
2 levels of set parameters to filter based on Excel cell values. Additionally populates set parameters to filter for dates derived from an Excel cell value. Allows for filling across.
- =Qlik.SenseEV("Sum({<[1st Level]={'"&$B$12&"'},[2nd Level]={'"&$C13&"'},Year = {$(=Year('"&E$10&"'))},[Month] = {$(=Month('"&E$10&"'))},Statement={'Income Statement'},DataCategory={'Actual'}>} [Amount])")
3 levels of set parameters to filter based on Excel cell values. Additionally populates set parameters to filter for dates derived from an Excel cell value. Allows for filling across.
- =Qlik.SenseEV("Sum({<[1st Level]={'"&$B$12&"'},[2nd Level]={'"&$B$14&"'},[3rd Level]={'"&$C15&"'},Year = {$(=Year('"&E$10&"'))},[Month] = {$(=Month('"&E$10&"'))},Statement={'Income Statement'},DataCategory={'Actual'}>} [Amount])")
Calculation for a snapshot in time, balance sheet, using AsOfMonth as the filter.
- =Qlik.SenseEV("Sum({<[1st Level]={'"&$B$12&"'},[2nd Level]={'"&$C14&"'},[AsOfMonth] ={'"&E$9&"'} ,Statement={'Balance Sheet'},DataCategory={'Actual'}>} [Amount])")
3 set parameters. 1st level is fixed. Second level allows filling down. 3rd level is fixed.
- =Qlik.SenseEV("Sum({<[1st Level]={'"&$B$11&"'},[2nd Level]={'"&$C12&"'},[CompanyID]={'"&E$9&"'},Statement={'Income Statement'},DataCategory={'Actual'}>} [Amount])")
3 set parameters. 1st and 2nd levels are fixed. 3rd level allow filling down.
- =Qlik.SenseEV("Sum({<[1st Level]={'"&$B$11&"'},[2nd Level]={'"&$B$13&"'},[3rd Level]={'"&$C14&"'},[CompanyID]={'"&E$9&"'},Statement={'Income Statement'},DataCategory={'Actual'}>} [Amount])")
- =Qlik.Image("https://domainname.com/images/image_1.jpg")
- =Qlik.Image("https://domainname.com/images/image_"&$B$1&".jpg")

