Profit and loss statement (P&L) made easy: automated calculations with AnalyticsGate and Excel
Preparing a profit and loss statement is a key financial reporting task for companies of all sizes. With AnalyticsGate and Excel it is possible to make this process fast and efficient. By automating data collection via Qlik Sense, data analysis and reporting, AnalyticsGate provides a good solution that goes far beyond the capabilities of traditional Excel templates. This allows companies to run their P&L with intelligent automation, which not only increases reliability, but also saves valuable time.
With AnalyticsGate, data from all kinds of business systems such as SAP, Oracle, Microsoft Dynamics 365, Salesforce and custom-built systems can be seamlessly integrated via Qlik Sense and processed in real time. This allows you to create on-demand reports that are tailored to your organisation's needs. Intelligent automation processes ensure that your financial data is always up-to-date and accurate - from initial data entry to the final P&L report.
In the following sections you will learn everything you need to know about P&L and how you can use AnalyticsGate's highly automated Excel templates to streamline this process. Below you'll find a real-life example of the advantages AnalyticsGate offers over standard Excel templates and how it simplifies the entire P&L process from data collection to report generation.
What is a P&L (definition)?
The profit and loss account is a statutory part of the financial statements under the German Commercial Code (HGB), which compares a company's income and expenses for a specified period, usually a financial year.
The profit and loss statement is used to determine the economic success of an enterprise by calculating the profit or loss from the difference between income and expenses. Unlike the balance sheet, which shows assets, liabilities and equity at a specific date, the income statement focuses on financial performance over a period of time.
Capital market-oriented companies and certain other companies are required by law to prepare a profit and loss account in order to document financial performance and ensure transparency towards stakeholders. The income statement is usually prepared at the end of the financial year and forms part of the annual financial statements, which must be published within certain deadlines.
What is the difference between balance sheet and profit and loss statement?
The main difference between the balance sheet and the P&L is the time reference: the balance sheet is based on a point in time, the P&L is based on a period of time. The balance sheet is a snapshot of the financial situation on a specific date and shows the assets, liabilities and equity. A balance sheet provides an overview of the company's resources and how they are financed.
The P&L, on the other hand, provides information on the earnings position and profitability of a company. While the balance sheet shows financial stability and liquidity, the income statement provides information on profitability and performance. Together they complement each other because the balance sheet shows the financial position at a particular point in time and the income statement shows the changes in that position due to operating activities over a period of time.
Who has to prepare a P&L?
All companies required to keep accounts under the German Commercial Code (HGB) must prepare a profit and loss account. This includes, in particular, merchants who are required to keep accounts and prepare annual financial statements under Section 238 of the HGB.
Sole traders with an annual turnover of more than €800,000 and an annual profit of more than €80,000 are also required to prepare a profit and loss account. However, smaller companies and freelancers who are not obliged to keep double-entry books can use a simpler profit and loss account (EÜR).
For capital companies, such as stock corporations (AGs) and limited liability companies (GmbHs), the preparation of a profit and loss statement is mandatory under Section 264 of the German Commercial Code (HGB). The legal requirement serves the purpose of transparency and comparability, as the companies concerned must be accountable to numerous external stakeholders, such as investors and creditors.
Capital market-oriented companies that operate internationally must also comply with International Financial Reporting Standards (IFRS), which require a comprehensive income statement. Certain partnerships and cooperatives must also prepare a profit and loss account if they are required to prepare annual accounts.
When must a P&L be prepared?
A profit and loss statement must be prepared at the end of each financial year. As the financial year for many companies ends on 31 December, the profit and loss account is often completed at that time. According to the German Commercial Code (HGB), capital market-oriented companies such as stock corporations (AGs) and limited liability companies (GmbHs) generally have four months to prepare and publish the profit and loss statement together with the annual financial statements.
For smaller and non-capital-market-oriented companies, the deadline for preparing the annual financial statements, including the income statement, is usually six to nine months. Timely preparation of the income statement is essential to meet legal requirements and to ensure transparent communication with stakeholders.
What is part of the P&L?
The profit and loss statement (P&L) includes the following components:
- Sales revenue
- Other company income
- Cost of materials
- Personnel expenses
- Depreciation
- Other operating expenses
- Financial result and profit or loss for the year
The P&L provides a comprehensive overview of a company's financial position. The detailed breakdown of income and expenses makes it possible to analyse a company's economic performance and make informed decisions for the future. A well-structured P&L is therefore not only a legal requirement, but also an important management tool for any company.
The components of the P&L explained in detail:
1. Revenue: This is the most important item on the income side of the P&L. Revenue includes all income earned by the company from the sale of goods or services. It reflects the core activities of the company and is a key indicator of its economic success.
2. Other operating income: This item includes all income that does not arise directly from the main business activity, such as proceeds from the sale of fixed assets, rental income or income from exchange rate gains.
3. Cost of materials: This includes the cost of raw materials, supplies and purchased goods used in the production process.
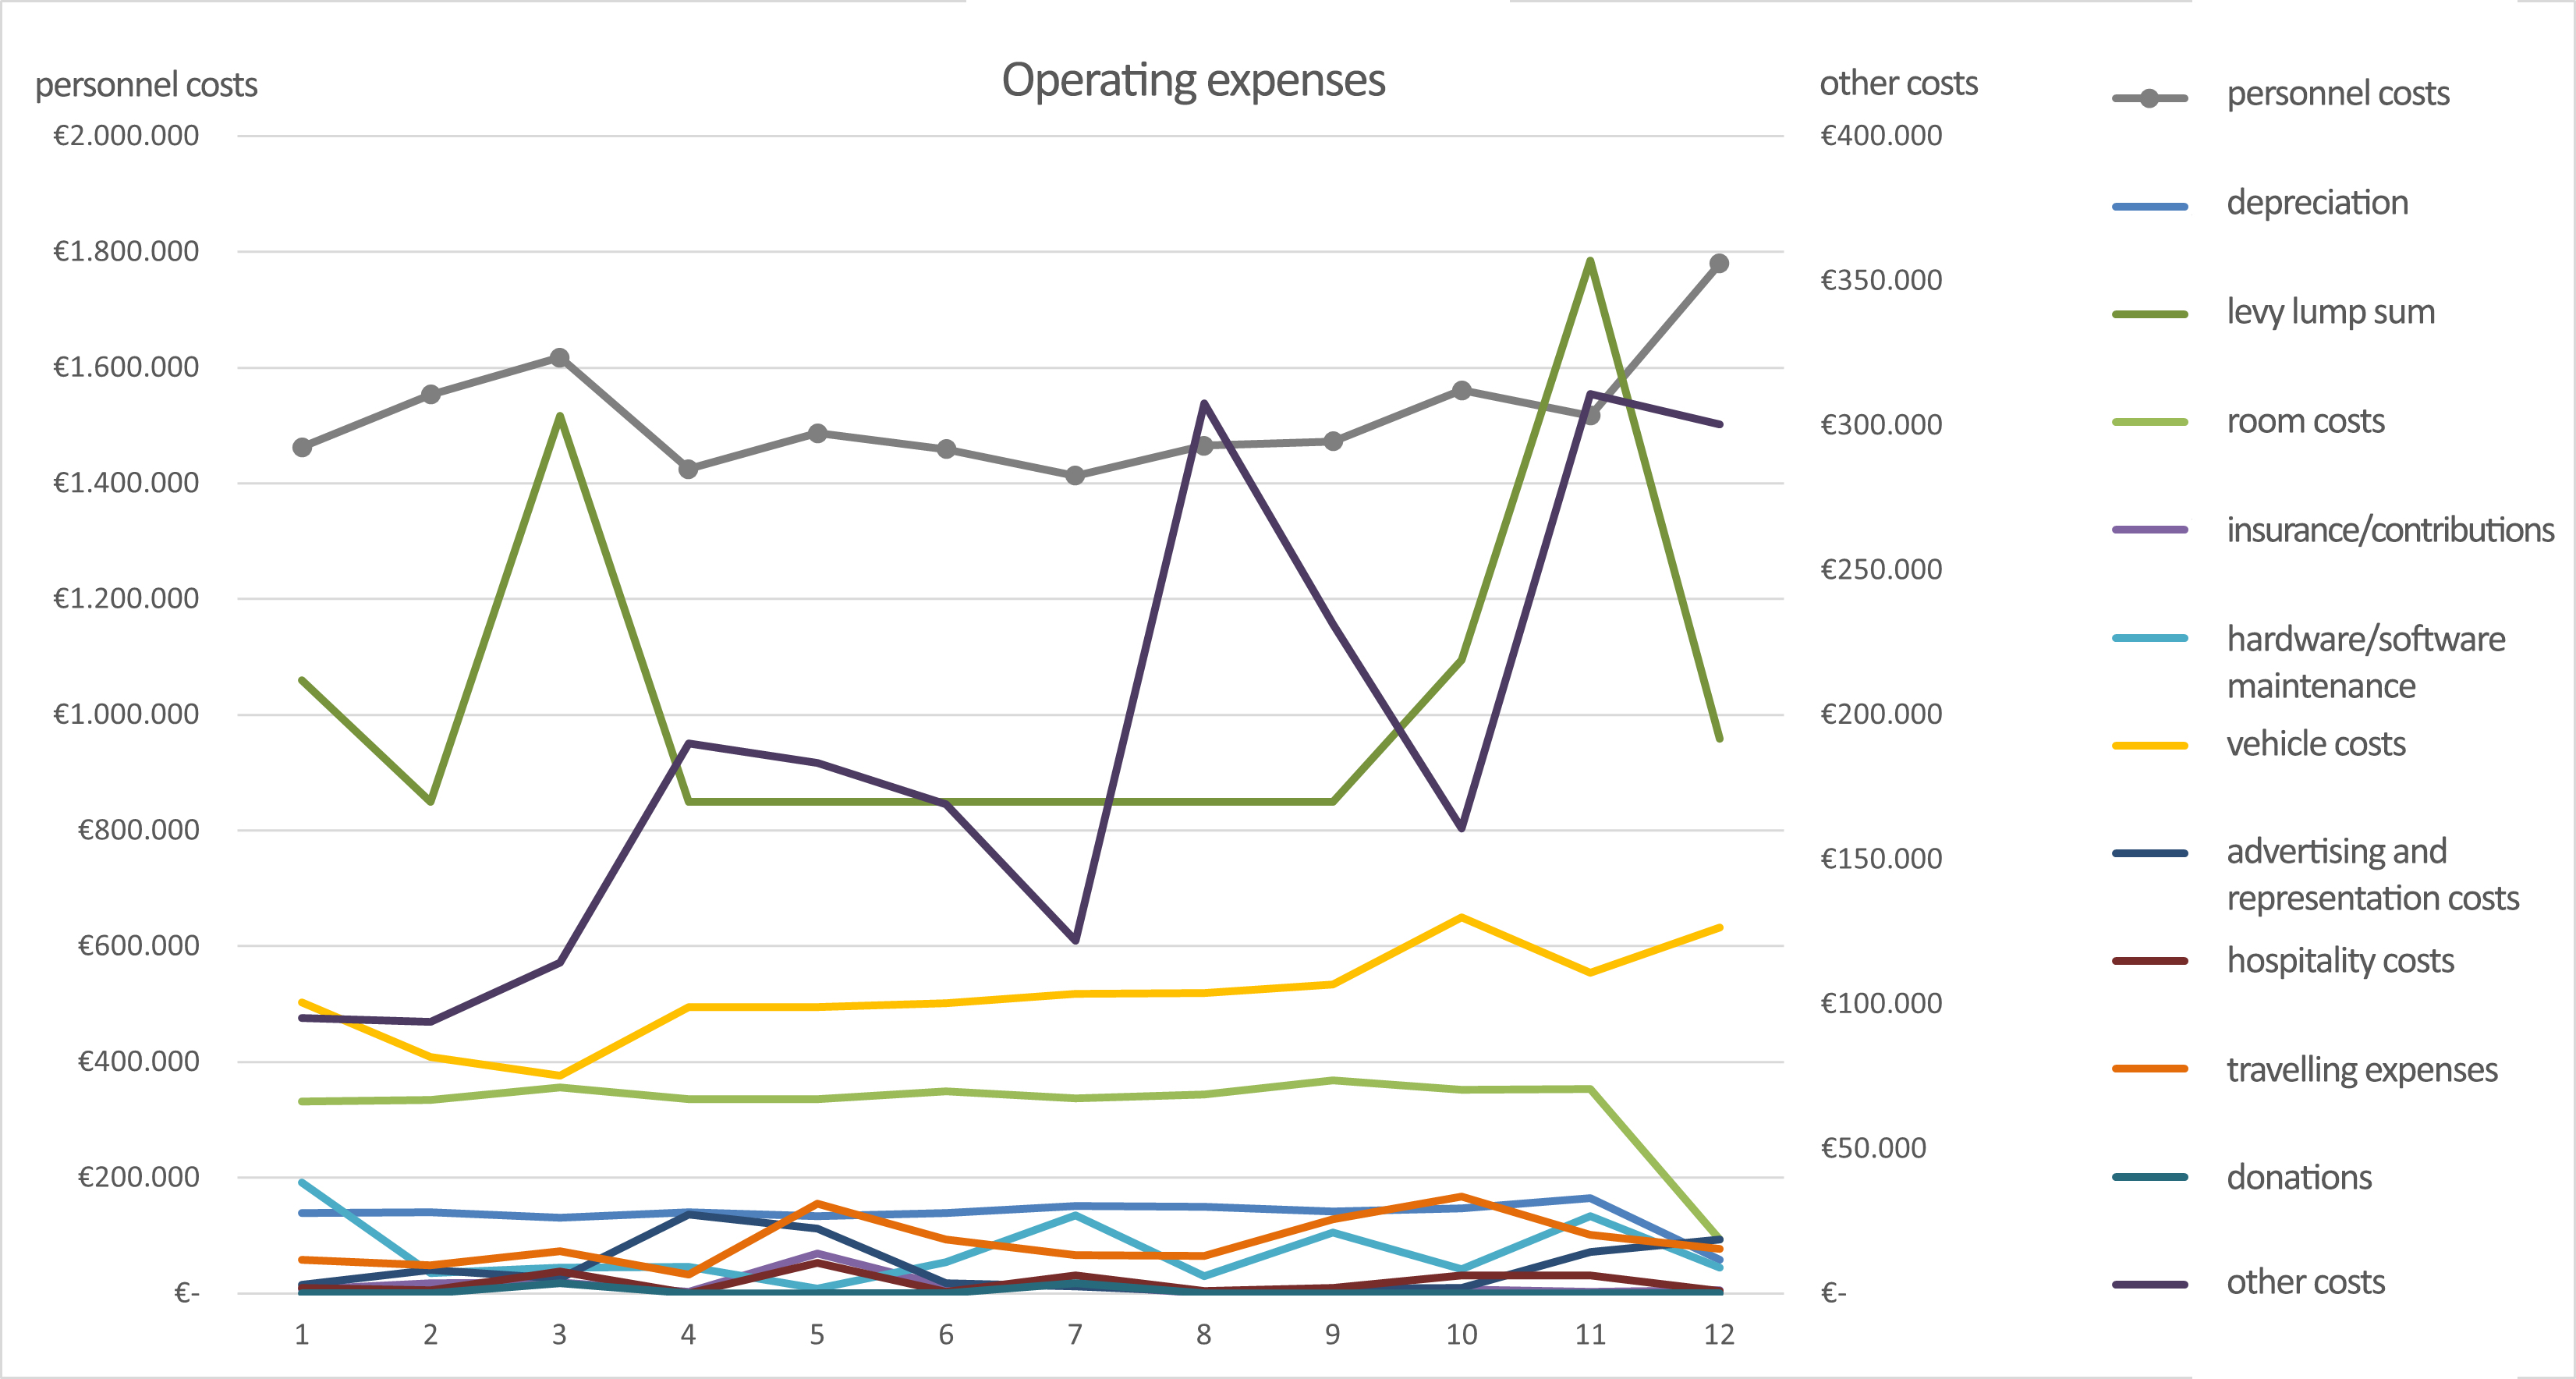
4. Personnel costs: This item includes all costs related to the employment of employees, including wages, salaries, social security contributions and other personnel-related costs.
5. Depreciation: Depreciation records the loss in value of fixed assets, such as machinery, buildings or vehicles, over their useful lives. This item is important to show the real depreciation of investments in the financial statements.
6. Other operating charges: This category includes all other costs associated with the business, such as rent, insurance, marketing expenses or office supplies. This item is often very broad and includes all expenses not specifically allocated to other categories.
7. Financial result: The financial result is made up of the interest income and interest expense of an enterprise. It includes, for example, interest on loans and income from investments. The financial result shows how dependent the company is on borrowed capital and how successfully it invests its capital.
8. Net profit or loss for the year: At the end of the income statement is the net profit or loss for the year, which represents the company's final profit or loss for the financial year. This amount is transferred to the balance sheet and affects the company's equity.
Use a P&L template for Excel
Using an Excel P&L template is a cost-effective, flexible and user-friendly solution that greatly simplifies the process. However, for more complex requirements and larger companies, such templates reach their limits. AnalyticsGate offers advanced features and capabilities that are particularly beneficial for companies with higher demands on data analysis and automation.
Automated P&L in Excel with AnalyticsGate
Automated P&L in Excel with AnalyticsGate enables data from different sources to be seamlessly integrated and updated in real time, making financial reporting more accurate, efficient and faster.
What are the advantages of AnalyticsGate compared to standard Excel templates?
Standard Excel templates provide a solid basis for preparing profit and loss statements, but they require manual customisation and are difficult to maintain. Simple templates are not well suited for complex and data-intensive business environments.
AnalyticsGate is the right solution for companies that want to digitise or automate their data intelligently.
AnalyticsGate offers much more than standard Excel templates you can download from the internet for P&L and other calculations, but how?
What makes AnalyticsGate unique:
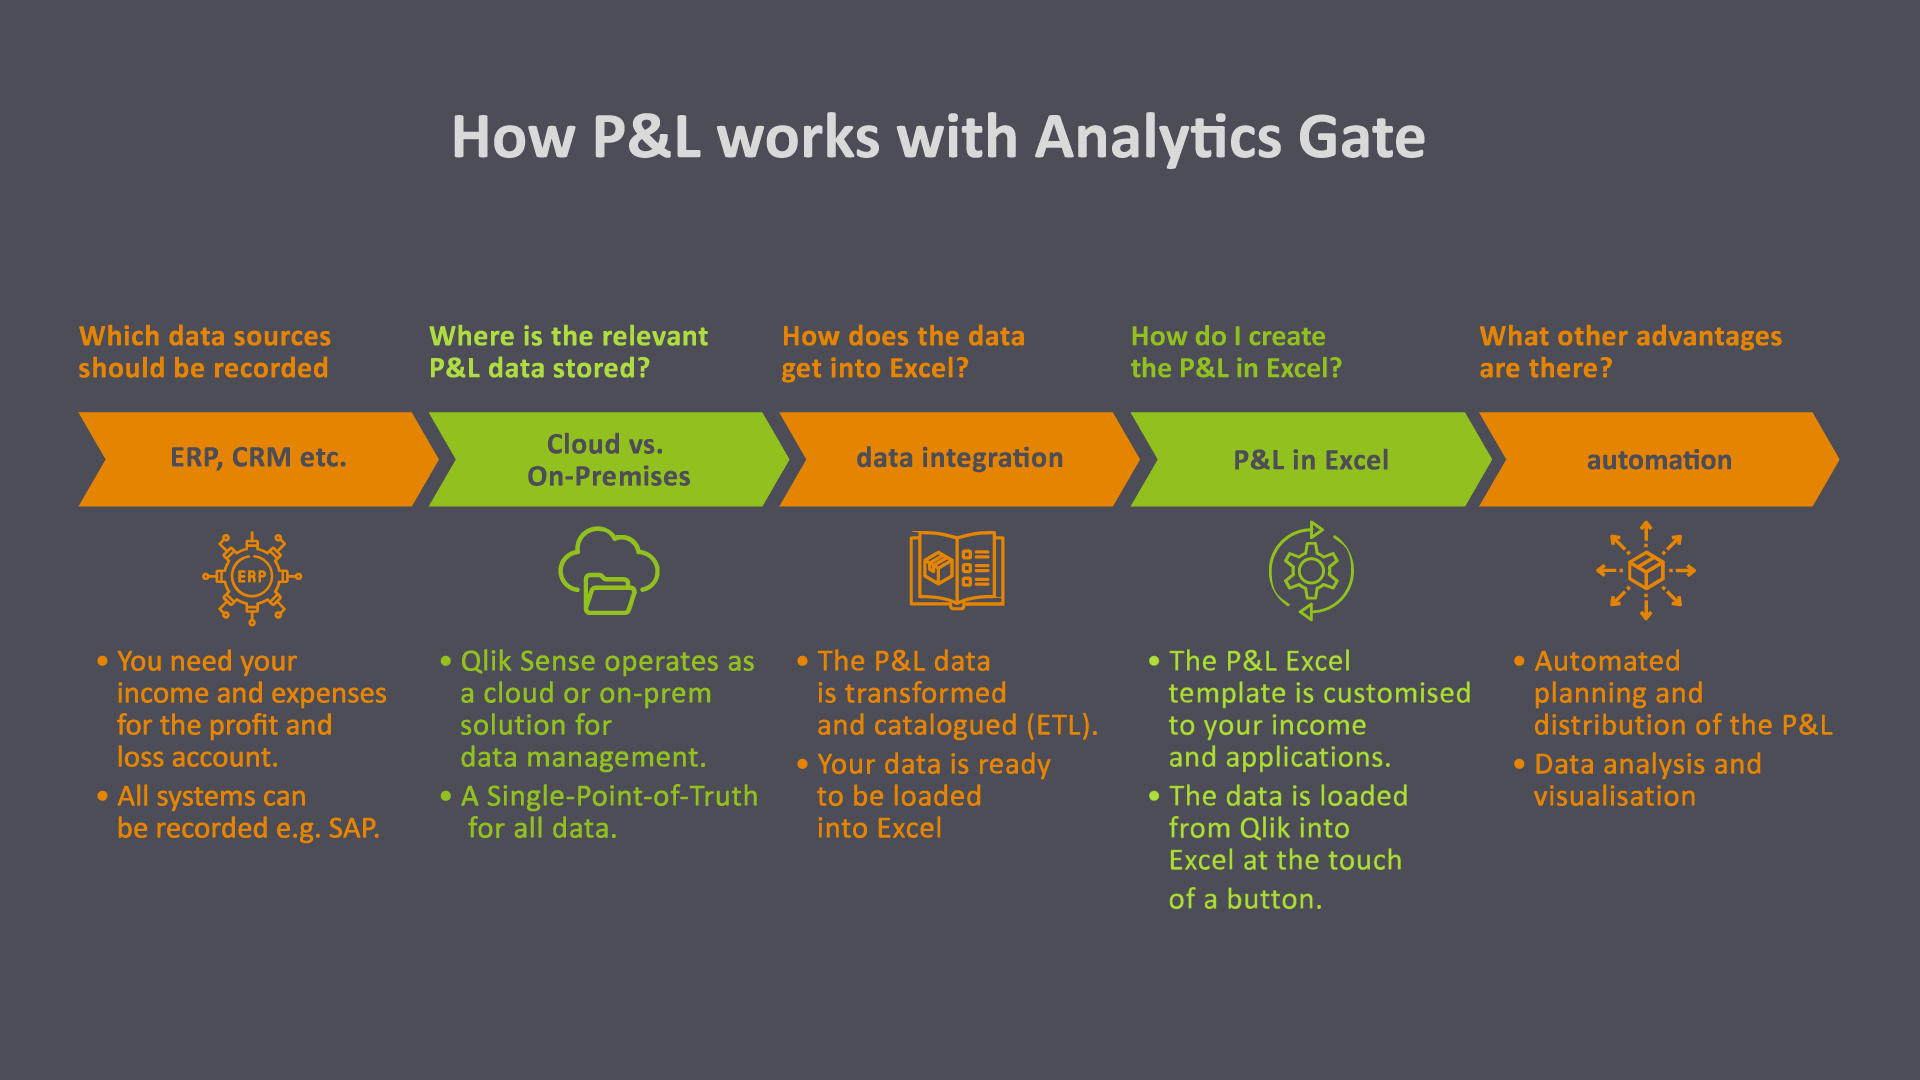
1. AnalyticsGate is not just a software, we are IT and data analysis specialists who can implement and optimise the entire data management process for you, from data collection (e.g. ERP and CRM systems), data storage (e.g. cloud storage or on-premises), data processing (ETL) to data analysis and process automation.
2. We support you every step of the way so that you end up with a P&L that is tailored to your needs. Most importantly, everyone can use Excel as they are used to.
3. We digitise your entire data infrastructure. From data collection to P&L automation, we can do it all. Together we integrate all processes and train your staff in the use of AnalyticsGate.
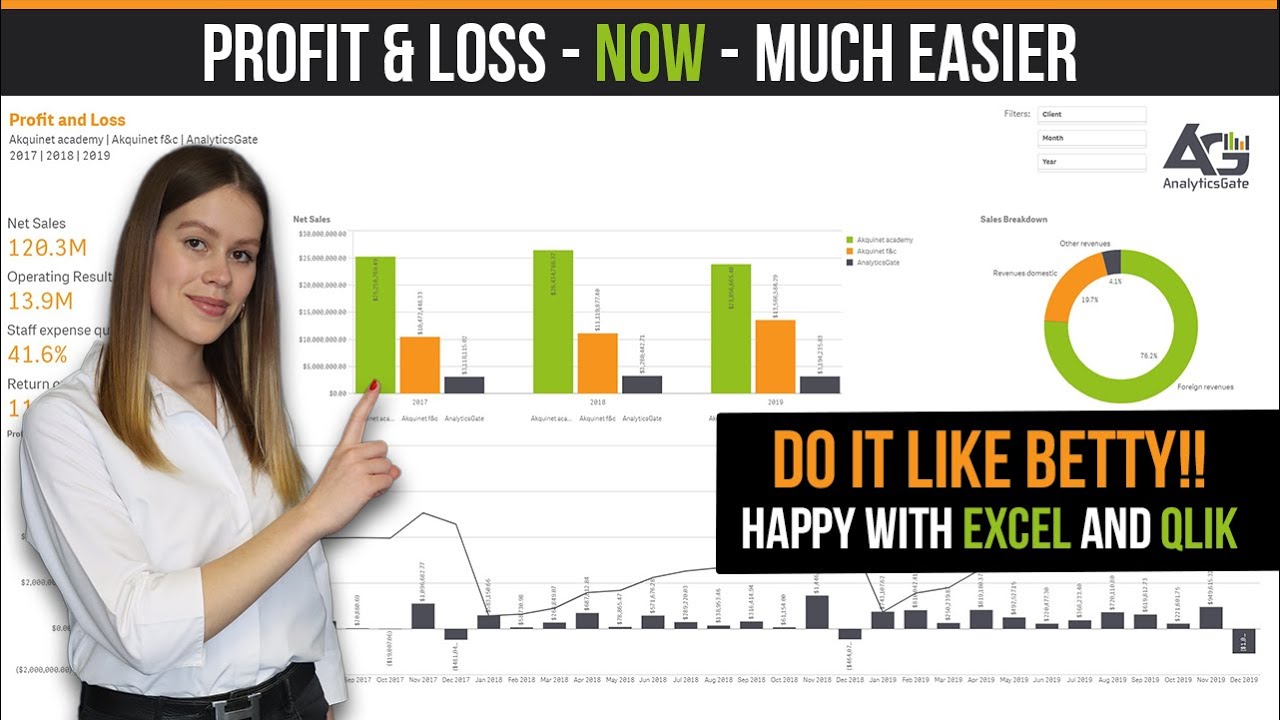
P&L in Excel with AnalyticsGate - it's that easy:
All relevant and up-to-date data is loaded into Excel at the push of a button: Unlike standard Excel templates that require manual customisation, AnalyticsGate loads the required P&L data directly into your customised Excel template.
Seamless data integration: Standard Excel templates require manual data entry, which is not only time-consuming but also increases the risk of errors. AnalyticsGate enables direct connection to all data sources via Qlik Sense. All revenues and expenses from your data sources are available and retrievable at any time in a single point of truth.
Intelligent automation: While standard Excel templates offer few automation options, AnalyticsGate allows full automation of recurring tasks such as updating reports, performing calculations and distributing reports. P&L reporting becomes more efficient, faster and more consistent.
Business case study: Automated P&L preparation with AnalyticsGate for a medium-sized company
For a medium-sized manufacturing company that needs to prepare a profit and loss statement on a regular basis in order to analyse its financial situation and make strategic decisions, the relevant data that needs to be included in the profit and loss statement are sales revenue, cost of materials, personnel expenses, other operating expenses, depreciation and financial income.
Origin of income statement data
In this company, the necessary P&L data comes from a combination of IT systems that are optimally tailored to the needs of the company:
- ERP system (SAP): This is where sales revenue, material costs and production costs are recorded, such as sales data from sales, inventory costs and production reports.
- CRM system (Salesforce): Manages sales revenue and customer orders, including information on completed sales and pending orders.
- Payroll system (DATEV): Records personnel costs, including wages, salaries and social security contributions.
Collection, storage and integration of P&L data
The relevant data sources for the P&L are collected from the company's data sources and integrated into the Qlik Cloud or the local Qlik Sense Enterprise. The data is transformed and categorised so that it is suitable for Excel.
Excel data import and editing
The transformed and catalogued data is now loaded into Excel via the AnalyticsGate add-in and the Qlik Connector.
The data is processed and analysed in Excel as usual. Thanks to AnalyticsGate's automation features, recurring tasks such as updating reports and adjusting formulas are now performed automatically within the company. This significantly reduces manual effort and minimises the risk of errors.
In addition, intelligent automation processes have been set up to automatically distribute reports to pre-defined individuals within the organisation.
Arrange a P&L consultation with AnalyticsGate
With AnalyticsGate your P&L will be more accurate, more efficient and faster. Contact us today for a free personal consultation to find out how automated P&L in Excel with AnalyticsGate can be implemented in your company.